After using Eclipse for some time, I have come to a state where Visual Studio Code is more appealing. And why? Because Eclipse messed up my repo once again. And I want to try something out with Visual Studio Code.
I like the interface and also its speed. The extensions are getting more available and even when you want to code with ARM/GNU.
I have made a screenshot of the plugins I am using.
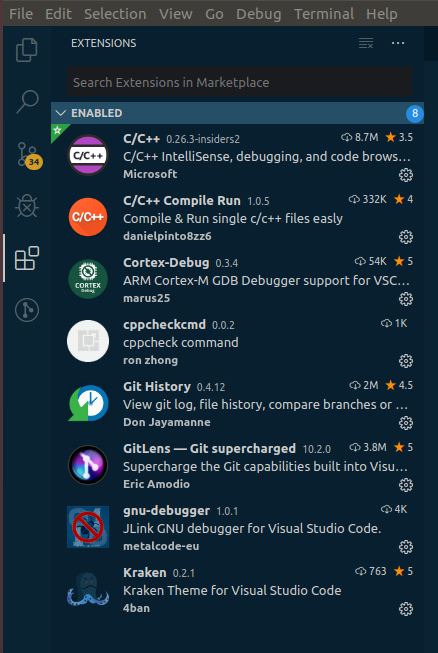
My workflow is simple but effective. And I cannot wait that Nuttx has its Apache repo up and running. So now, the examples are still based on Nuttx 8.2.
For debugging, I use the Cortex-Debug extension. Simple, but fast and has some excellent features, and I use ST MCU most of the time, and then you can also load its SVD (=System View Description) file. You can find those at https://www.st.com/en/microcontrollers-microprocessors/stm32-high-performance-mcus.html
To get it all working, you have to make a “Debug Config.” Just click on the “turtle icon with a cross” and create a *.json file.
I will give an example of an OpenOCD file which works for me:
{
     // Use IntelliSense to learn about possible attributes.
     // Hover to view descriptions of existing attributes.
     // For more information, visit: https://go.microsoft.com/fwlink/?linkid=830387
     "version": "0.2.0",
     "configurations": [
         {
             "cwd": "${workspaceFolder}",
             "executable": "${workspaceFolder}/nuttx",
             "name": "Debug Microcontroller",
             "request": "launch",
             "type": "cortex-debug",
             "servertype": "openocd",
             "interface": "swd",
             "svdFile": "/home/ds/Documents/SVD_Files_STM32/en.stm32f4_svd/STM32F4_svd_V1.2/STM32F407.svd",
             "configFiles": [
                 "interface/stlink.cfg",
                 "target/stm32f4x.cfg"
             ],
             "preRestartCommands": [
                 "file nuttx",
                 "load",
                 "add-symbol-file nuttx 0x8000000",
                 "enable breakpoint",
                 "monitor reset"
             ],
             "showDevDebugOutput": true
        }
 }
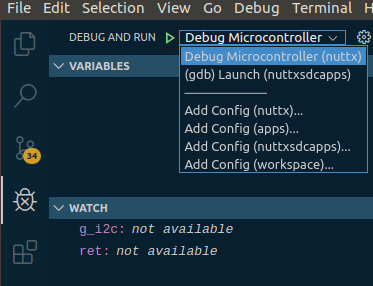
Now you can run your “debugger” by choosing the Debug Config file in the selection menu on the top left in your IDE. Next to the button, “Debug and Run.” And then, you will spot a config with the name: “Debug Microcontroller.”
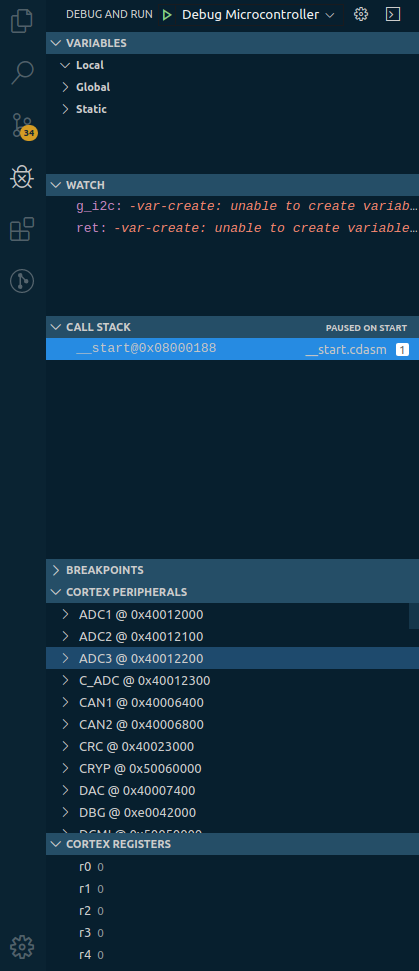
You will get features like below: Peripherals, Registers, Watch, etc…
Happy debugging!!!
And have a great 2020!!!!!!!!